Finding the max neuronal response (PCALDA)
Now we want to repeatedly sample the responses to a variety of stimuli so that we can characterize what feature combination triggers a spike or a behavior.
$$
P(response | stimulus) = P(response | s1, s2, s3,..., sn )
$$
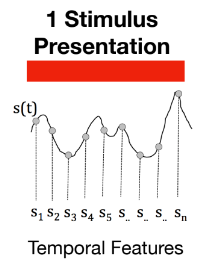
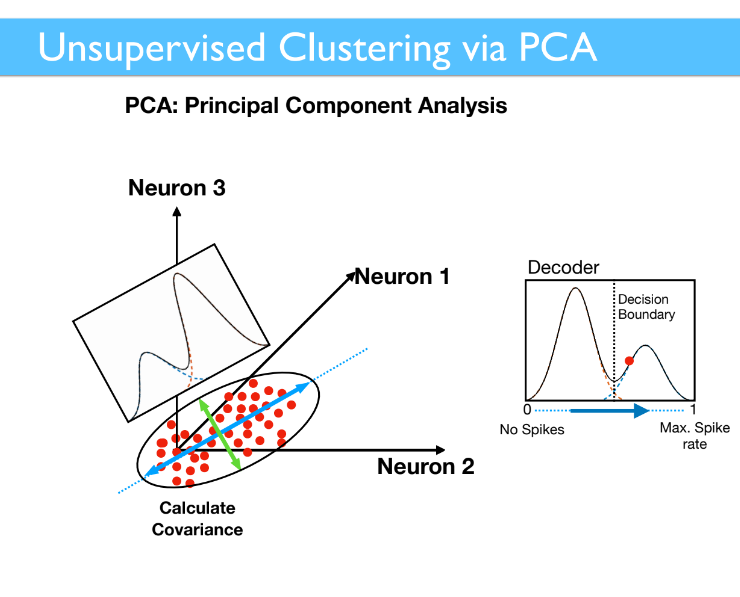
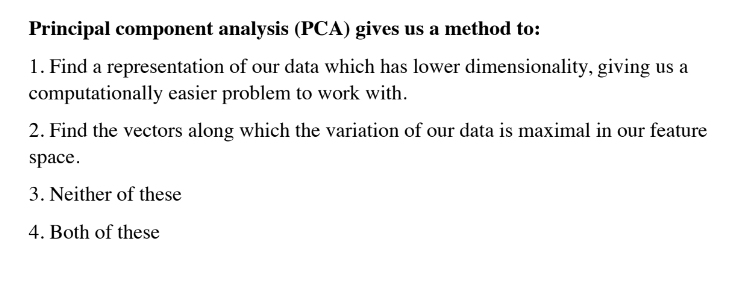
We sample the stimuli signal and plot the intensity of the neuronal response of each feature on it's respective axis. This will help us characterize what feature combination triggers a spike or a behavior. We do this repeatedly. (so each point is the response of the neuron to each feature)
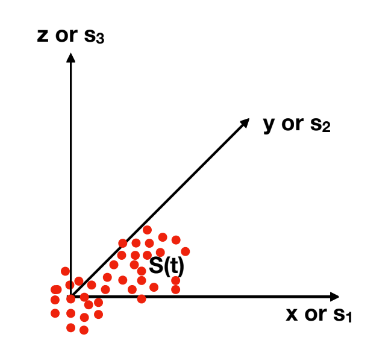
Either we know the type of stimuli presented, either we don't. This will define the type of approach we use next.

Finding the single neuron response vector
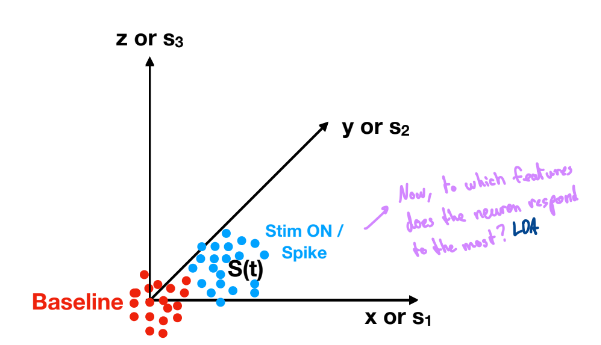
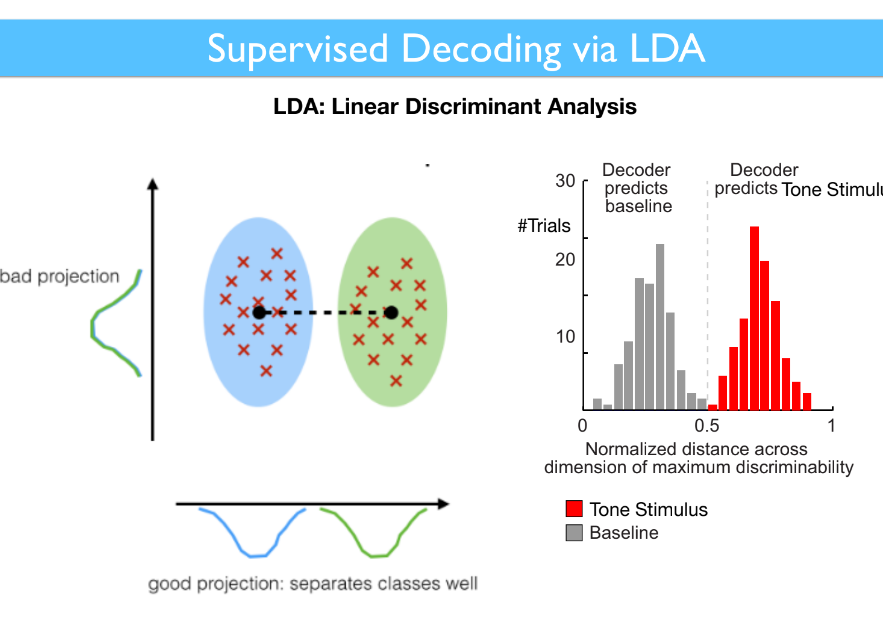
Linear Discriminant Analysis
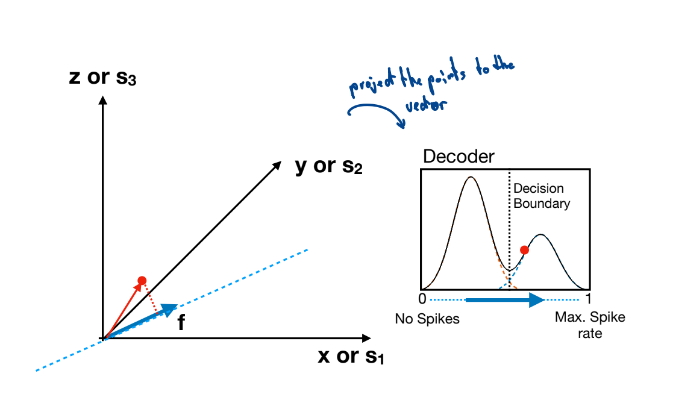
We find the vector (Neuronal response vector) that discriminates the best both groups.
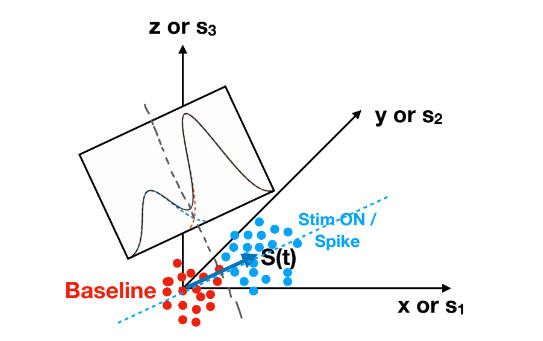
Next, we project every stimuli onto this vector
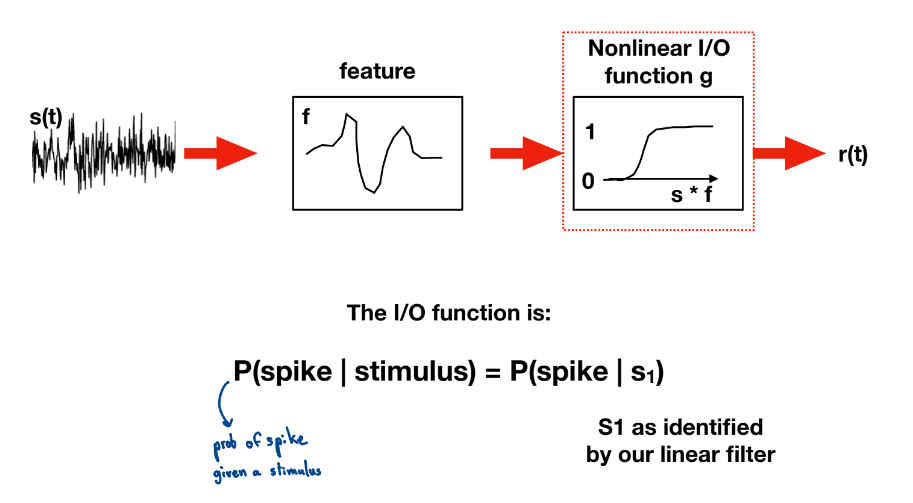
Finding the IO function for a single neuron
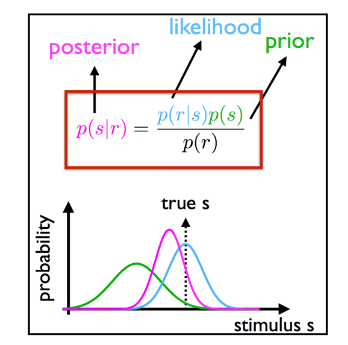
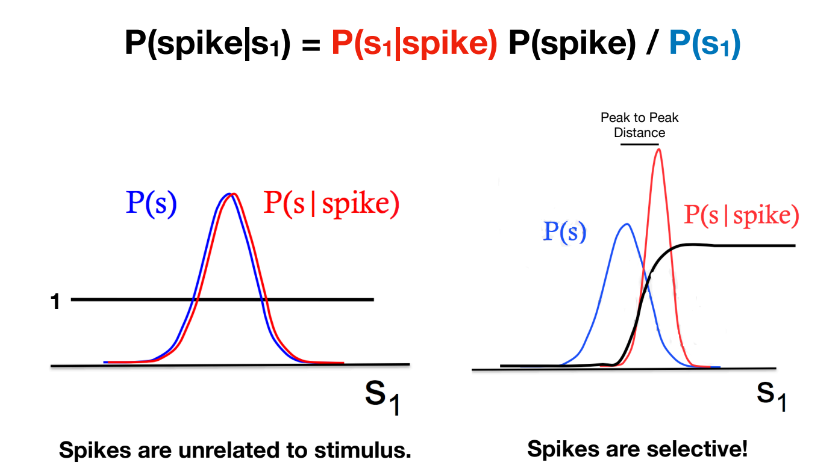
Using Bayes rule
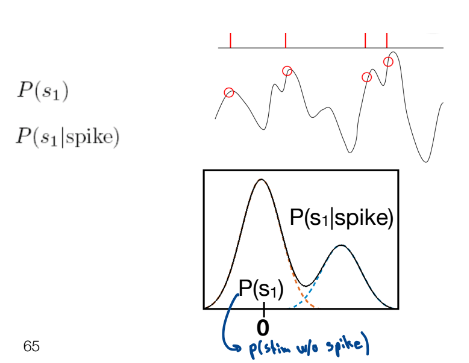
In our case:
$$
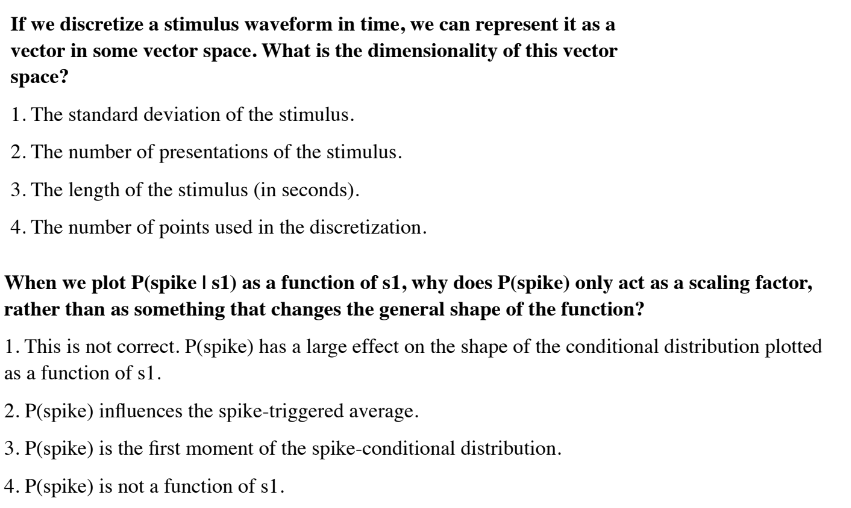
P(\text{spike}|s_{1})=\frac{P(s_{1}|\text{spike})P(\text{spike})}{P(s_{1})}
$$
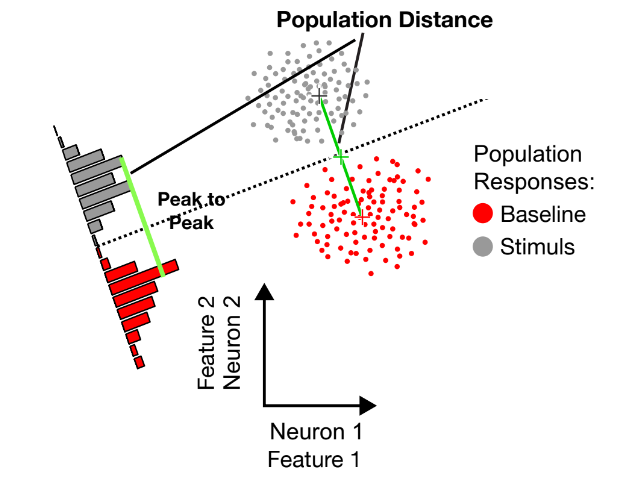
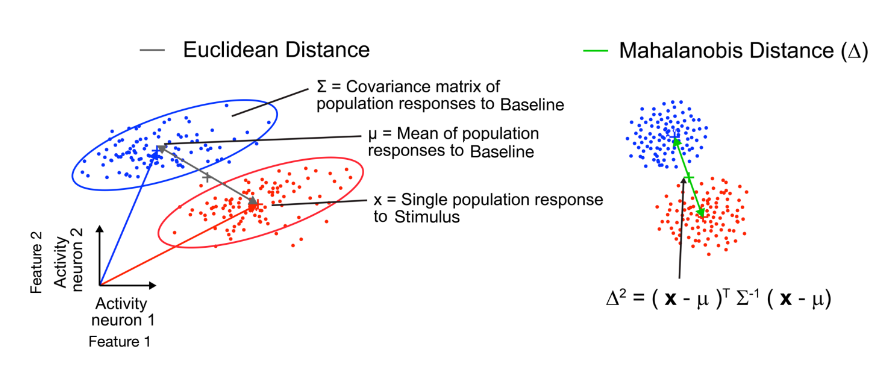
Population distance metrics
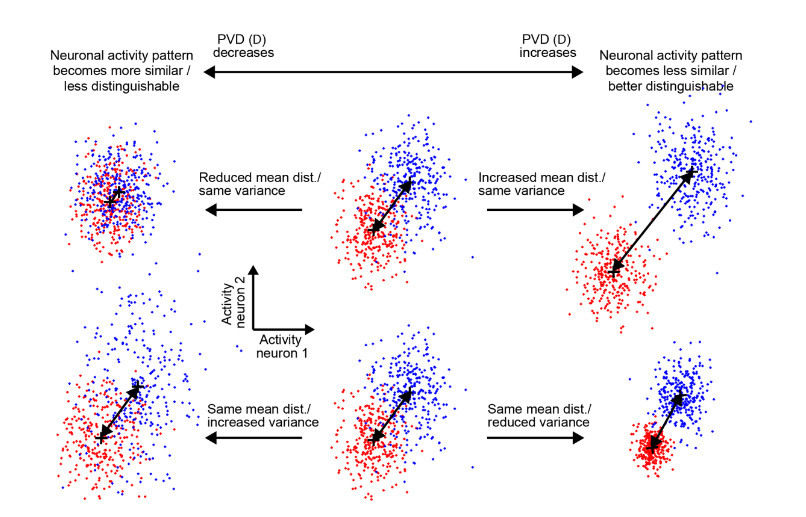
Information depends on two factors:
- Distance between two different feature/population responses (when similar: not much information encoded)
- Variance: becomes very hard with big variance => more overlap, when small easier to decode
a)4
b)4
c)4